Medical Malpractice Statistics
An Analysis of Payment Data by Field of License

Medical malpractice occurs when a healthcare professional fails to meet the accepted standards of the medical profession, causing injury or death to a patient.
When a patient (or their estate) that a medical practitioner failed to meet the standards of their profession, and that the negligence was the cause of the injury or death in question — they can take legal action against the practitioner.
But malpractice doesn’t only happen in the case of severe outcomes like death or permanent injuries; errors as simple as prescribing an incorrect medication might open a provider up to a claim.
What are the most common malpractice allegations? Do they differ depending on the type of medicine being practiced? And what are the outcomes when patients bring claims against their medical providers?
To answer these questions, Youman & Caputo LLC worked with 1Point21 Interactive to analyze data of nearly 300,000 medical malpractice payments dating from 2000 to 2020 collected by the National Practitioner Data Bank (NPDB), an online repository maintained by the U.S. Department of Health and Human Services.
The NBPD, which was established by Congress in 1986, contains reports on medical malpractice payments and other “adverse actions related to health care practitioners, providers and suppliers. It was designed to prevent healthcare providers from being able to move from state to state in order to hide knowledge of their previous bad acts or damaging performance.
Findings
More than 95% of the malpractice payments in the NPDB were based on claims made against practitioners belonging to 10 license fields:
- Physicians with MD degrees
- Physicians with DO (doctor of osteopathic medicine) degrees
- Dentists
- Podiatrists
- Pharmacists
- Physician Assistants
- Nurse Practitioners
- Nurse Anesthetists
- Registered Nurses
- Chiropractors
The most common allegations also fall into 10 different categories:
- Improper performance: Occurs when a practitioner performs a treatment or procedure incorrectly, causing the patient’s condition to worsen. This could include situations like a surgeon leaving a loose screw or small surgical tool inside a patient’s body.
- Improper management: Occurs when a practitioner fails to correctly manage a patient’s care. This could include failing to communicate about treatment options, giving incorrect doses of medicine, or many other situations.
- Improper technique: Occurs when a patient’s condition is harmed as the result of a practitioner using a technique other than the most commonly accepted techniques for treating that condition
- Misdiagnosis, failure to diagnose, or delay in diagnosis: Occurs when a patient’s condition worsens because a practitioner diagnoses the patient with a different condition (misdiagnosis), fails to recognize that there is a medical condition at all (failure to diagnose), or is unable to reach a correct diagnosis as quickly as a doctor who was working at the proper standard of competence (delay in diagnosis). Acts that could lead to these claims include failing to order diagnostic tests or misinterpreting the results of a patient’s MRI scan.
- Failure to treat: Occurs when a condition is correctly diagnosed, but the practitioner does not follow through on that diagnosis. Examples could include discharging a patient too soon or not providing proper follow-up care instructions.
- Complication not recognized: Occurs when a provider fails to promptly recognize and treat complications that arise from treatment or surgery, regardless of whether the complication was itself caused by negligence. Can also occur when a practitioner does not take the proper precautions to minimize or avoid the risk of known complications.
- Failure to monitor: Occurs when a practitioner does not keep proper track of a patient’s condition, allowing the condition to worsen. Failure to monitor claims can involve patients who are in surgery or under anesthesia, the development of adverse side effects as a result of a treatment, or patients under observation for conditions such as head injuries.
- Delay in treatment: Occurs when a patient fails to receive treatment in a reasonable time frame. This could include failure to schedule lab testing, set up physical therapy appointments, or prescribe medication in a timely manner.
The visualizations below break down the types of claims made against practitioners in those 10 fields, the most common outcomes suffered by patients making allegations, and the amounts paid out by practitioners.
How to read these charts:
Hover over area to highlight and see the name of license field
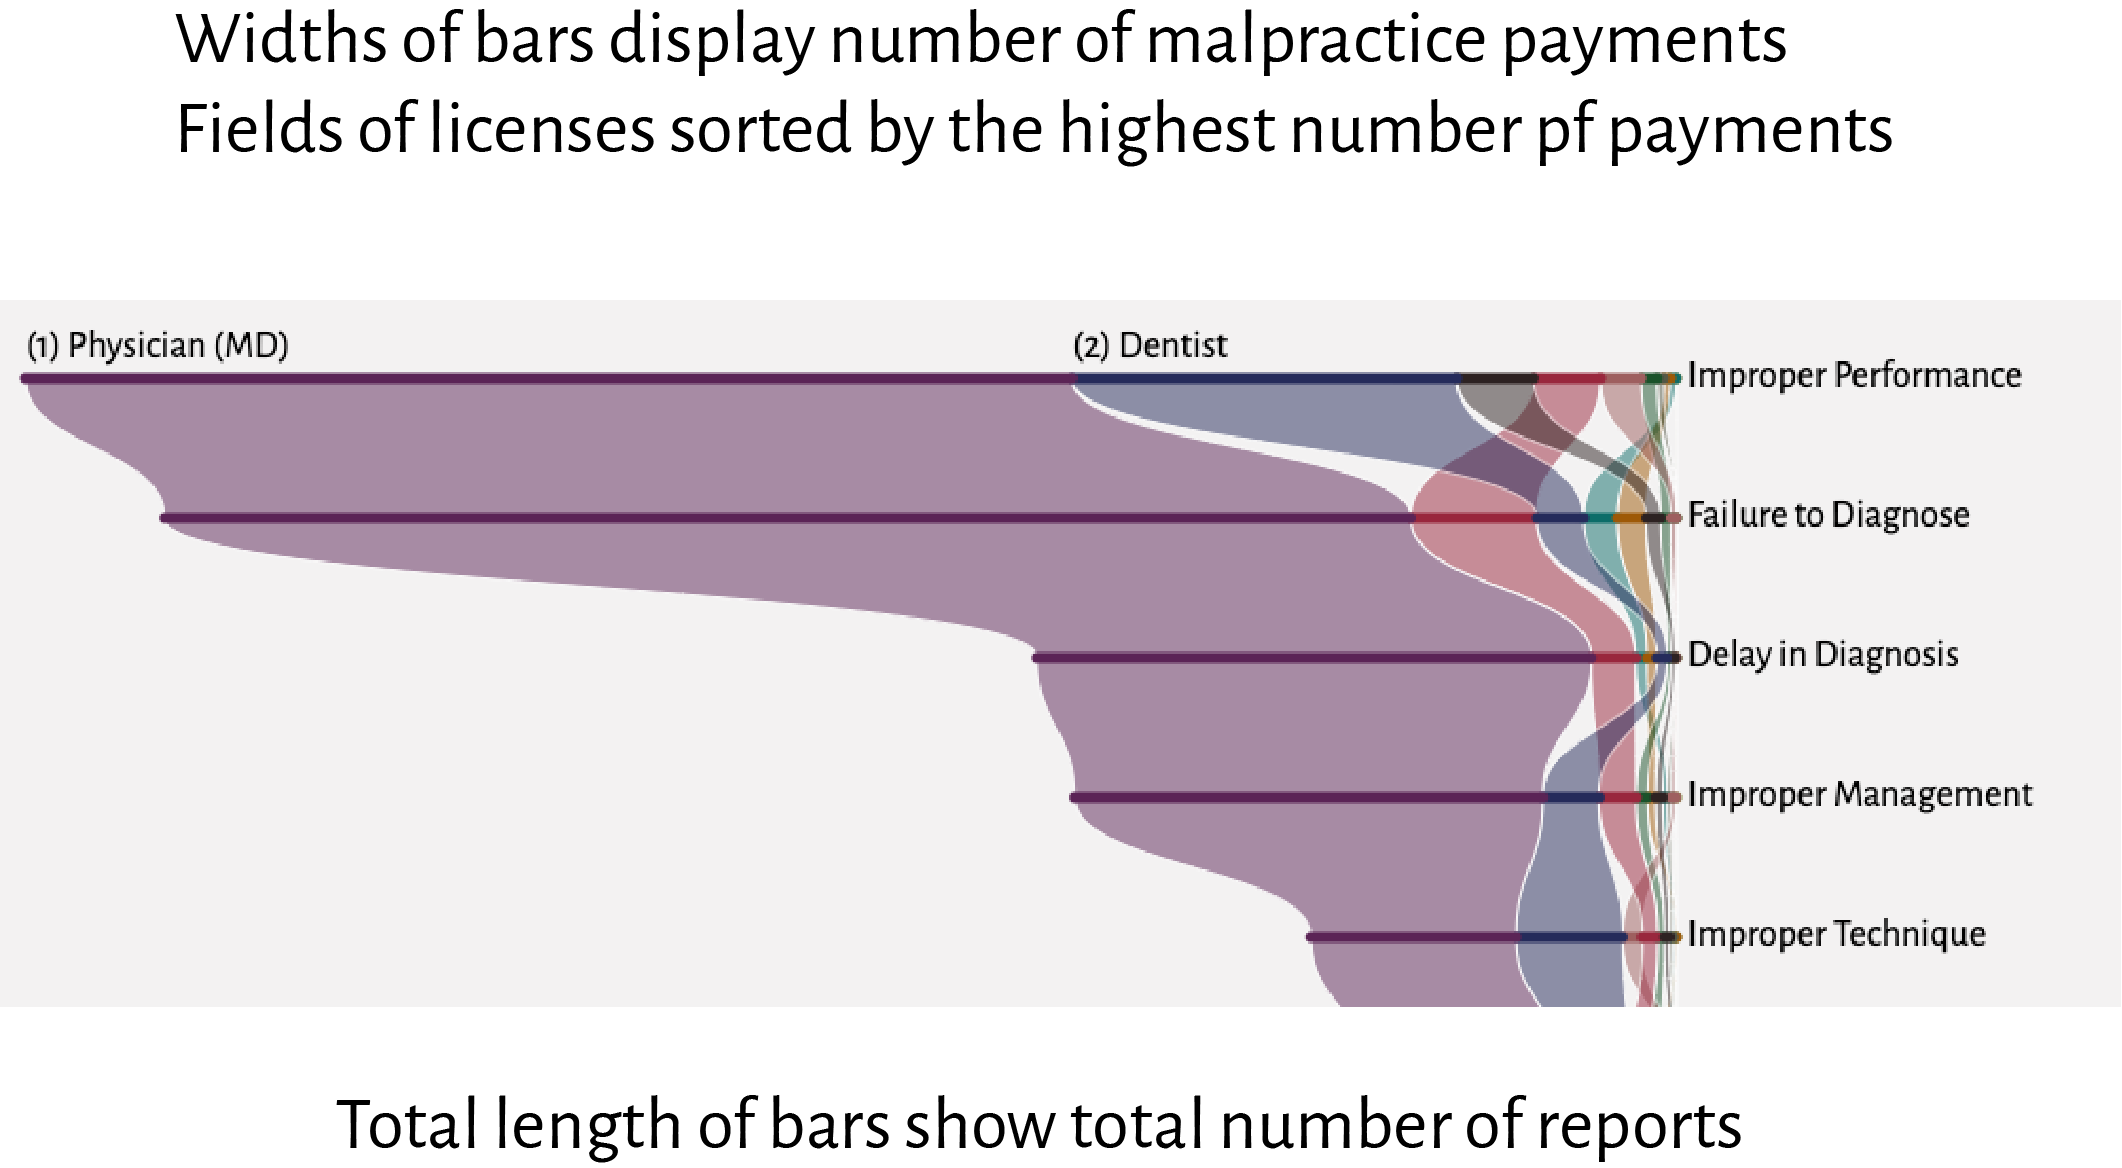
Most common allegations by license field
No group made more medical malpractice payments than physicians with MD degrees, who accounted for 70% of all malpractice payments from 2000 to 2020. They were responsible for the largest number of malpractice payouts for every allegation category, including over 80% of the payments for failure to diagnose.
The second most frequent payers were dentists, whose most common payments related to allegations of improper performance or improper technique. Nearly half of the malpractice payments made due to errors by podiatrists were in response to allegations of improper performance, while registered nurses were the most likely group by percentage to face allegations of failure to monitor.
Field highlighted:
Explore data:
| License | Allegations | Number of payments | Percent |
|---|---|---|---|
| Physician (MD) | Other | 67,503 | 73% |
| Physician (MD) | Improper Performance | 34,053 | 63% |
| Physician (MD) | Failure to Diagnose | 40,546 | 82% |
| Dentist | Other | 9,944 | 11% |
| Physician (MD) | Delay in Diagnosis | 18,035 | 87% |
| Dentist | Improper Performance | 12,510 | 23% |
| Physician (MD) | Improper Management | 15,230 | 78% |
| Physician (DO) | Other | 4,733 | 5% |
| Physician (MD) | Improper Technique | 6,672 | 56% |
| Registered Nurse | Other | 3,260 | 4% |
| Physician (MD) | Failure to Treat | 6,422 | 64% |
| Physician (DO) | Failure to Diagnose | 4,089 | 8% |
| Physician (MD) | Complication not recognized | 6,431 | 82% |
| Physician (MD) | Failure to Monitor | 5,294 | 68% |
| Podiatrist | Improper Performance | 2,494 | 5% |
| Podiatrist | Other | 1,645 | 2% |
| Physician (MD) | Delay in Treatment | 5,894 | 84% |
| Physician (MD) | Misdiagnosis | 4,712 | 86% |
| Chiropractor | Other | 1,634 | 2% |
| Dentist | Improper Technique | 3,461 | 29% |
| Physician (DO) | Improper Performance | 2,182 | 4% |
| Dentist | Failure to Diagnose | 1,524 | 3% |
| Dentist | Improper Management | 1,829 | 9% |
| Pharmacist | Other | 1,254 | 1% |
| Dentist | Failure to Treat | 2,077 | 21% |
| Physician Assistant | Failure to Diagnose | 1,104 | 2% |
| Physician (DO) | Delay in Diagnosis | 1,444 | 7% |
| Nurse Practitioner | Other | 949 | 1% |
| Physician (DO) | Improper Management | 1,206 | 6% |
| Registered Nurse | Failure to Monitor | 1,279 | 16% |
| Chiropractor | Improper Performance | 1,317 | 2% |
| Nurse Practitioner | Failure to Diagnose | 929 | 2% |
| Chiropractor | Improper Technique | 640 | 5% |
| Physician Assistant | Other | 834 | 1% |
| Physician (DO) | Failure to Treat | 624 | 6% |
| Physician (DO) | Complication not recognized | 446 | 6% |
| Physician Assistant | Delay in Diagnosis | 361 | 2% |
| Registered Nurse | Improper Management | 378 | 2% |
| Physician (DO) | Failure to Monitor | 456 | 6% |
| Registered Nurse | Improper Performance | 526 | 1% |
| Physician (DO) | Delay in Treatment | 477 | 7% |
| Physician (DO) | Improper Technique | 500 | 4% |
| Podiatrist | Failure to Diagnose | 470 | 1% |
| Dentist | Complication not recognized | 393 | 5% |
| Nurse Practitioner | Delay in Diagnosis | 332 | 2% |
| Nurse Practitioner | Improper Management | 261 | 1% |
| Registered Nurse | Failure to Treat | 381 | 4% |
| Physician (DO) | Misdiagnosis | 372 | 7% |
| Dentist | Failure to Monitor | 217 | 3% |
| Nurse Anesthetist | Other | 759 | 1% |
| Dentist | Delay in Treatment | 207 | 3% |
| Podiatrist | Improper Management | 229 | 1% |
| Dentist | Delay in Diagnosis | 332 | 2% |
| Nurse Anesthetist | Improper Performance | 222 | 0% |
| Registered Nurse | Improper Technique | 223 | 2% |
| Registered Nurse | Complication not recognized | 255 | 3% |
| Nurse Practitioner | Failure to Monitor | 193 | 2% |
| Nurse Practitioner | Failure to Treat | 217 | 2% |
| Registered Nurse | Failure to Diagnose | 350 | 1% |
| Registered Nurse | Delay in Treatment | 200 | 3% |
| Physician Assistant | Improper Management | 156 | 1% |
| Dentist | Misdiagnosis | 113 | 2% |
| Nurse Practitioner | Improper Performance | 206 | 0% |
| Podiatrist | Improper Technique | 167 | 1% |
| Nurse Anesthetist | Failure to Monitor | 177 | 2% |
| Podiatrist | Complication not recognized | 84 | 1% |
| Physician Assistant | Failure to Treat | 171 | 2% |
| Registered Nurse | Delay in Diagnosis | 126 | 1% |
| Physician Assistant | Misdiagnosis | 111 | 2% |
| Nurse Anesthetist | Improper Management | 142 | 1% |
| Nurse Practitioner | Delay in Treatment | 104 | 1% |
| Nurse Practitioner | Complication not recognized | 77 | 1% |
| Nurse Anesthetist | Improper Technique | 106 | 1% |
| Physician Assistant | Improper Performance | 185 | 0% |
| Nurse Practitioner | Misdiagnosis | 82 | 1% |
| Physician Assistant | Failure to Monitor | 88 | 1% |
| Podiatrist | Delay in Diagnosis | 122 | 1% |
| Chiropractor | Failure to Diagnose | 156 | 0% |
| Nurse Anesthetist | Complication not recognized | 73 | 1% |
| Physician Assistant | Delay in Treatment | 90 | 1% |
| Podiatrist | Failure to Treat | 124 | 1% |
| Chiropractor | Improper Management | 115 | 1% |
| Physician Assistant | Improper Technique | 68 | 1% |
| Podiatrist | Misdiagnosis | 74 | 1% |
| Physician Assistant | Complication not recognized | 63 | 1% |
| Chiropractor | Failure to Monitor | 50 | 1% |
| Podiatrist | Delay in Treatment | 59 | 1% |
| Nurse Practitioner | Improper Technique | 53 | 0% |
| Chiropractor | Delay in Diagnosis | 41 | 0% |
| Podiatrist | Failure to Monitor | 39 | 0% |
| Chiropractor | Complication not recognized | 29 | 0% |
| Pharmacist | Improper Management | 35 | 0% |
| Registered Nurse | Misdiagnosis | 24 | 0% |
| Chiropractor | Failure to Treat | 20 | 0% |
| Nurse Anesthetist | Delay in Treatment | 15 | 0% |
| Pharmacist | Improper Performance | 20 | 0% |
| Nurse Anesthetist | Failure to Diagnose | 15 | 0% |
| Nurse Anesthetist | Delay in Diagnosis | 9 | 0% |
| Pharmacist | Failure to Monitor | 9 | 0% |
| Nurse Anesthetist | Failure to Treat | 8 | 0% |
| Chiropractor | Misdiagnosis | 7 | 0% |
| Pharmacist | Complication not recognized | 7 | 0% |
| Chiropractor | Delay in Treatment | 5 | 0% |
| Pharmacist | Delay in Diagnosis | 6 | 0% |
| Pharmacist | Failure to Diagnose | 5 | 0% |
| Pharmacist | Improper Technique | 4 | 0% |
| Pharmacist | Delay in Treatment | 2 | 0% |
| Pharmacist | Misdiagnosis | 2 | 0% |
| Pharmacist | Failure to Treat | 1 | 0% |
| Nurse Anesthetist | Misdiagnosis | 0 | 0% |
Outcomes
Physicians with MDs were also the most likely to face malpractice payments in claims where their patients died — 5 out of every 6 payouts involving death were made due to claims against MD physicians.
In fact, MDs were the most common payers in every outcome except for insignificant injuries; nearly half of all insignificant injury malpractice payments were linked to dentists.
Physicians with DO degrees were the second most likely practitioner group, behind their MD counterparts, to face claims after their patients either died or suffered permanent injuries.
Field highlighted:
Explore data:
| License | Outcome | Number of payments | Percent |
|---|---|---|---|
| Physician (MD) | Death | 52,591 | 83% |
| Physician (MD) | Minor Temporary Injury | 16,478 | 48% |
| Physician (MD) | Significant Permanent Injury | 25,603 | 82% |
| Physician (MD) | Minor Permanent Injury | 19,385 | 68% |
| Physician (MD) | Major Temporary Injury | 17,738 | 73% |
| Physician (MD) | Major Permanent Injury | 18,402 | 82% |
| Dentist | Insignificant Injury | 3,250 | 49% |
| Physician (DO) | Death | 4,749 | 8% |
| Physician (MD) | Quadriplegic, Brain Damage | 8,458 | 84% |
| Dentist | Minor Temporary Injury | 11,948 | 35% |
| Dentist | Minor Permanent Injury | 5,150 | 18% |
| Dentist | Cannot Be Determined | 473 | 18% |
| Registered Nurse | Death | 2,363 | 4% |
| Physician (DO) | Significant Permanent Injury | 2,145 | 7% |
| Podiatrist | Minor Temporary Injury | 1,243 | 4% |
| Physician (DO) | Minor Temporary Injury | 1,169 | 3% |
| Physician (DO) | Minor Permanent Injury | 1,501 | 5% |
| Physician (DO) | Major Temporary Injury | 1,255 | 5% |
| Physician (DO) | Major Permanent Injury | 1,421 | 6% |
| Physician (MD) | Emotional Injury Only | 2,649 | 68% |
| Nurse Practitioner | Death | 1,244 | 2% |
| Dentist | Emotional Injury Only | 510 | 13% |
| Physician (MD) | Insignificant Injury | 2,598 | 39% |
| Registered Nurse | Minor Temporary Injury | 913 | 3% |
| Registered Nurse | Major Temporary Injury | 731 | 3% |
| Physician (MD) | Cannot Be Determined | 1,602 | 60% |
| Registered Nurse | Major Permanent Injury | 537 | 2% |
| Podiatrist | Minor Permanent Injury | 944 | 3% |
| Podiatrist | Significant Permanent Injury | 796 | 3% |
| Physician Assistant | Death | 987 | 2% |
| Chiropractor | Minor Temporary Injury | 860 | 3% |
| Podiatrist | Major Temporary Injury | 643 | 3% |
| Dentist | Major Temporary Injury | 2,552 | 10% |
| Registered Nurse | Significant Permanent Injury | 490 | 2% |
| Chiropractor | Minor Permanent Injury | 467 | 2% |
| Physician (DO) | Quadriplegic, Brain Damage | 725 | 7% |
| Podiatrist | Major Permanent Injury | 489 | 2% |
| Chiropractor | Major Temporary Injury | 615 | 3% |
| Pharmacist | Minor Temporary Injury | 484 | 1% |
| Dentist | Significant Permanent Injury | 953 | 3% |
| Physician Assistant | Significant Permanent Injury | 405 | 1% |
| Dentist | Major Permanent Injury | 490 | 2% |
| Registered Nurse | Minor Permanent Injury | 393 | 1% |
| Nurse Practitioner | Major Permanent Injury | 416 | 2% |
| Dentist | Death | 491 | 1% |
| Nurse Practitioner | Minor Temporary Injury | 374 | 1% |
| Nurse Anesthetist | Death | 488 | 1% |
| Chiropractor | Significant Permanent Injury | 379 | 1% |
| Registered Nurse | Quadriplegic, Brain Damage | 426 | 4% |
| Physician Assistant | Major Temporary Injury | 288 | 1% |
| Chiropractor | Insignificant Injury | 176 | 3% |
| Physician Assistant | Minor Permanent Injury | 334 | 1% |
| Physician (DO) | Emotional Injury Only | 194 | 5% |
| Physician Assistant | Major Permanent Injury | 328 | 1% |
| Pharmacist | Insignificant Injury | 172 | 3% |
| Chiropractor | Cannot Be Determined | 251 | 9% |
| Nurse Practitioner | Major Temporary Injury | 276 | 1% |
| Physician Assistant | Minor Temporary Injury | 350 | 1% |
| Registered Nurse | Emotional Injury Only | 159 | 4% |
| Nurse Practitioner | Significant Permanent Injury | 343 | 1% |
| Physician (DO) | Insignificant Injury | 172 | 3% |
| Nurse Practitioner | Quadriplegic, Brain Damage | 150 | 1% |
| Nurse Practitioner | Minor Permanent Injury | 265 | 1% |
| Podiatrist | Death | 172 | 0% |
| Chiropractor | Emotional Injury Only | 129 | 3% |
| Physician (DO) | Cannot Be Determined | 108 | 4% |
| Chiropractor | Major Permanent Injury | 171 | 1% |
| Registered Nurse | Insignificant Injury | 116 | 2% |
| Nurse Anesthetist | Quadriplegic, Brain Damage | 110 | 1% |
| Pharmacist | Major Temporary Injury | 171 | 1% |
| Registered Nurse | Cannot Be Determined | 66 | 2% |
| Nurse Practitioner | Emotional Injury Only | 86 | 2% |
| Pharmacist | Death | 136 | 0% |
| Physician Assistant | Insignificant Injury | 56 | 1% |
| Physician Assistant | Quadriplegic, Brain Damage | 106 | 1% |
| Nurse Anesthetist | Minor Temporary Injury | 169 | 0% |
| Nurse Anesthetist | Minor Permanent Injury | 135 | 0% |
| Nurse Anesthetist | Major Permanent Injury | 136 | 1% |
| Pharmacist | Cannot Be Determined | 52 | 2% |
| Nurse Anesthetist | Significant Permanent Injury | 113 | 0% |
| Pharmacist | Emotional Injury Only | 62 | 2% |
| Podiatrist | Insignificant Injury | 49 | 1% |
| Podiatrist | Cannot Be Determined | 43 | 2% |
| Nurse Anesthetist | Major Temporary Injury | 85 | 0% |
| Chiropractor | Death | 81 | 0% |
| Physician Assistant | Emotional Injury Only | 37 | 1% |
| Nurse Practitioner | Insignificant Injury | 48 | 1% |
| Chiropractor | Quadriplegic, Brain Damage | 29 | 0% |
| Nurse Practitioner | Cannot Be Determined | 41 | 2% |
| Dentist | Quadriplegic, Brain Damage | 23 | 0% |
| Nurse Anesthetist | Emotional Injury Only | 34 | 1% |
| Pharmacist | Significant Permanent Injury | 40 | 0% |
| Pharmacist | Minor Permanent Injury | 32 | 0% |
| Nurse Anesthetist | Insignificant Injury | 30 | 0% |
| Pharmacist | Major Permanent Injury | 29 | 0% |
| Physician Assistant | Cannot Be Determined | 26 | 1% |
| Podiatrist | Quadriplegic, Brain Damage | 15 | 0% |
| Podiatrist | Emotional Injury Only | 8 | 0% |
| Pharmacist | Quadriplegic, Brain Damage | 6 | 0% |
| Nurse Anesthetist | Cannot Be Determined | 3 | 0% |
Payments
The public data available through the NBPD does not contain information about specific amounts of medical malpractice payments, instead grouping payouts in certain ranges to the midpoints of those ranges. We’ve further grouped those payouts into five buckets: $1 to $25,000; $25,001 to $100,000; $100,001 to $500,000; $500,000 to $1 million; and over $1 million.
MD physicians represented the upper end of the payment spectrum; nearly 9 out of 10 of the million-dollar malpractice payments from 2000 to 2020 were made by MDs, as well as more than 80% of the $100,001 to $500,000 and $500,001 to $1 million claims.
Meanwhile, dentists, chiropractors and pharmacists were most likely to have smaller payouts. 85% of the payments made within those licensing fields were $100,000 or less, and more than half were below the $25,000 threshold.
Field highlighted:
Explore data:
| License | Payment range | Number of payments | Percent |
|---|---|---|---|
| Physician (MD) | $1,100,001 - $100,000,000 | 8,290 | 88% |
| Physician (MD) | $500,001 - $1,000,000 | 29,507 | 86% |
| Physician (MD) | $100,001 - $500,000 | 94,489 | 82% |
| Physician (MD) | $25,0001 - $100,000 | 53,936 | 70% |
| Physician (MD) | $1 - $25,000 | 24,569 | 49% |
| Dentist | $25,0001 - $100,000 | 10,564 | 14% |
| Physician (DO) | $100,001 - $500,000 | 8,058 | 7% |
| Dentist | $100,001 - $500,000 | 4,111 | 4% |
| Physician (DO) | $25,0001 - $100,000 | 4,287 | 6% |
| Dentist | $1 - $25,000 | 17,316 | 35% |
| Podiatrist | $100,001 - $500,000 | 2,239 | 2% |
| Chiropractor | $1 - $25,000 | 1,747 | 3% |
| Podiatrist | $25,0001 - $100,000 | 2,102 | 3% |
| Registered Nurse | $100,001 - $500,000 | 2,235 | 2% |
| Registered Nurse | $1 - $25,000 | 1,739 | 3% |
| Registered Nurse | $25,0001 - $100,000 | 2,069 | 3% |
| Physician (DO) | $1 - $25,000 | 1,728 | 3% |
| Physician (DO) | $500,001 - $1,000,000 | 1,990 | 6% |
| Nurse Practitioner | $100,001 - $500,000 | 1,363 | 1% |
| Chiropractor | $25,0001 - $100,000 | 1,218 | 2% |
| Pharmacist | $1 - $25,000 | 851 | 2% |
| Physician Assistant | $100,001 - $500,000 | 1,294 | 1% |
| Registered Nurse | $500,001 - $1,000,000 | 597 | 2% |
| Nurse Practitioner | $25,0001 - $100,000 | 966 | 1% |
| Podiatrist | $1 - $25,000 | 825 | 2% |
| Dentist | $500,001 - $1,000,000 | 511 | 1% |
| Chiropractor | $100,001 - $500,000 | 852 | 1% |
| Physician Assistant | $25,0001 - $100,000 | 946 | 1% |
| Nurse Practitioner | $500,001 - $1,000,000 | 396 | 1% |
| Nurse Practitioner | $1 - $25,000 | 599 | 1% |
| Physician (DO) | $1,100,001 - $100,000,000 | 466 | 5% |
| Physician Assistant | $500,001 - $1,000,000 | 377 | 1% |
| Nurse Anesthetist | $100,001 - $500,000 | 660 | 1% |
| Physician Assistant | $1 - $25,000 | 547 | 1% |
| Podiatrist | $500,001 - $1,000,000 | 322 | 1% |
| Registered Nurse | $1,100,001 - $100,000,000 | 362 | 4% |
| Nurse Anesthetist | $25,0001 - $100,000 | 370 | 0% |
| Nurse Anesthetist | $500,001 - $1,000,000 | 229 | 1% |
| Dentist | $1,100,001 - $100,000,000 | 105 | 1% |
| Pharmacist | $25,0001 - $100,000 | 266 | 0% |
| Nurse Anesthetist | $1 - $25,000 | 231 | 0% |
| Chiropractor | $500,001 - $1,000,000 | 189 | 1% |
| Nurse Practitioner | $1,100,001 - $100,000,000 | 79 | 1% |
| Pharmacist | $100,001 - $500,000 | 174 | 0% |
| Physician Assistant | $1,100,001 - $100,000,000 | 67 | 1% |
| Nurse Anesthetist | $1,100,001 - $100,000,000 | 36 | 0% |
| Podiatrist | $1,100,001 - $100,000,000 | 19 | 0% |
| Pharmacist | $500,001 - $1,000,000 | 38 | 0% |
| Pharmacist | $1,100,001 - $100,000,000 | 16 | 0% |
| Chiropractor | $1,100,001 - $100,000,000 | 8 | 0% |
Explore more
Below are more interactive visualizations showing the different kinds of allegations faced by each practitioner type, the patient outcomes in those cases, and the size of the payments rendered as a result of malpractice claims.
Allegations
Outcomes
Payments
Methodology and Data Sources
All data comes from the National Practitioner Data Bank’s database of medical malpractice payment reports from 2000 through 2020.
We grouped the reports by practitioner license, allegation type, patient outcome and payment amount. The NPDB’s public-facing data does not contain specific payment amounts or any other specific information that would identify individual practitioners or payments.
Feel free to republish the information from this story, but if you do, please provide attribution by linking back to this page.